Broadly diversified
Our strategic asset allocation
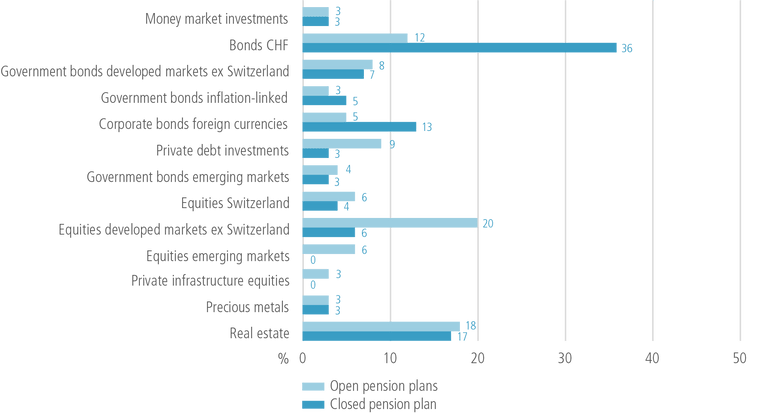
Shares, bonds, real estate, precious metals and infrastructure projects are the most important asset classes in which we invest our active members’ pension capital.
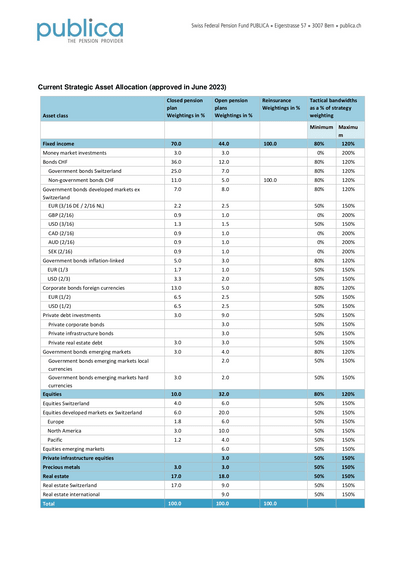
The strategic asset allocation defines the asset classes we invest pension capital in, and what proportion we invest in each. The most important asset classes are shares, bonds, real estate, precious metals and infrastructure projects.
PUBLICA has eleven open and one closed pension plans. The open plans are made up of active members and pension recipients. The closed plan contains only pension recipients, which means it is less able to absorb risks. For this reason, there is one strategic asset allocation for the open pension plans and another for the closed one.
Current strategic asset allocation
PUBLICA’s investment year 2025
PUBLICA generated a solid, 6.6% return on its investments in 2025. The most important contributors were equities and gold.

Performance and funded ratio
The investment guidelines
The investment guidelines contain specific rules telling staff of PUBLICA Asset Management how they should invest pension assets: